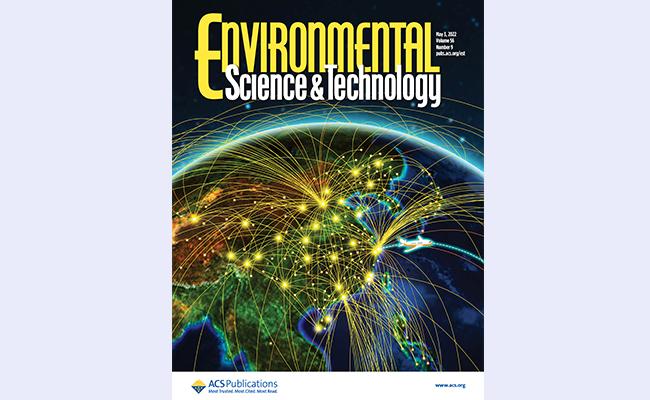
Figure 1 The study was selected as the supplementary cover article of Environmental Science and Technology (ES&T)
Economic growth and globalization have led to a surge in civil aviation transportation demand. Among the major economies in the world, China has witnessed a 12-fold increase in terms of total passenger aviation traffic volume since 2000 and is expected to become the world's largest aviation market soon. To better understand the environmental impacts of China's aviation sector, this study developed a real-world flight trajectory-based emission model and a high-spatial-resolution emission model of CO2 and various pollutants from China’s aviation covering various flight phases.
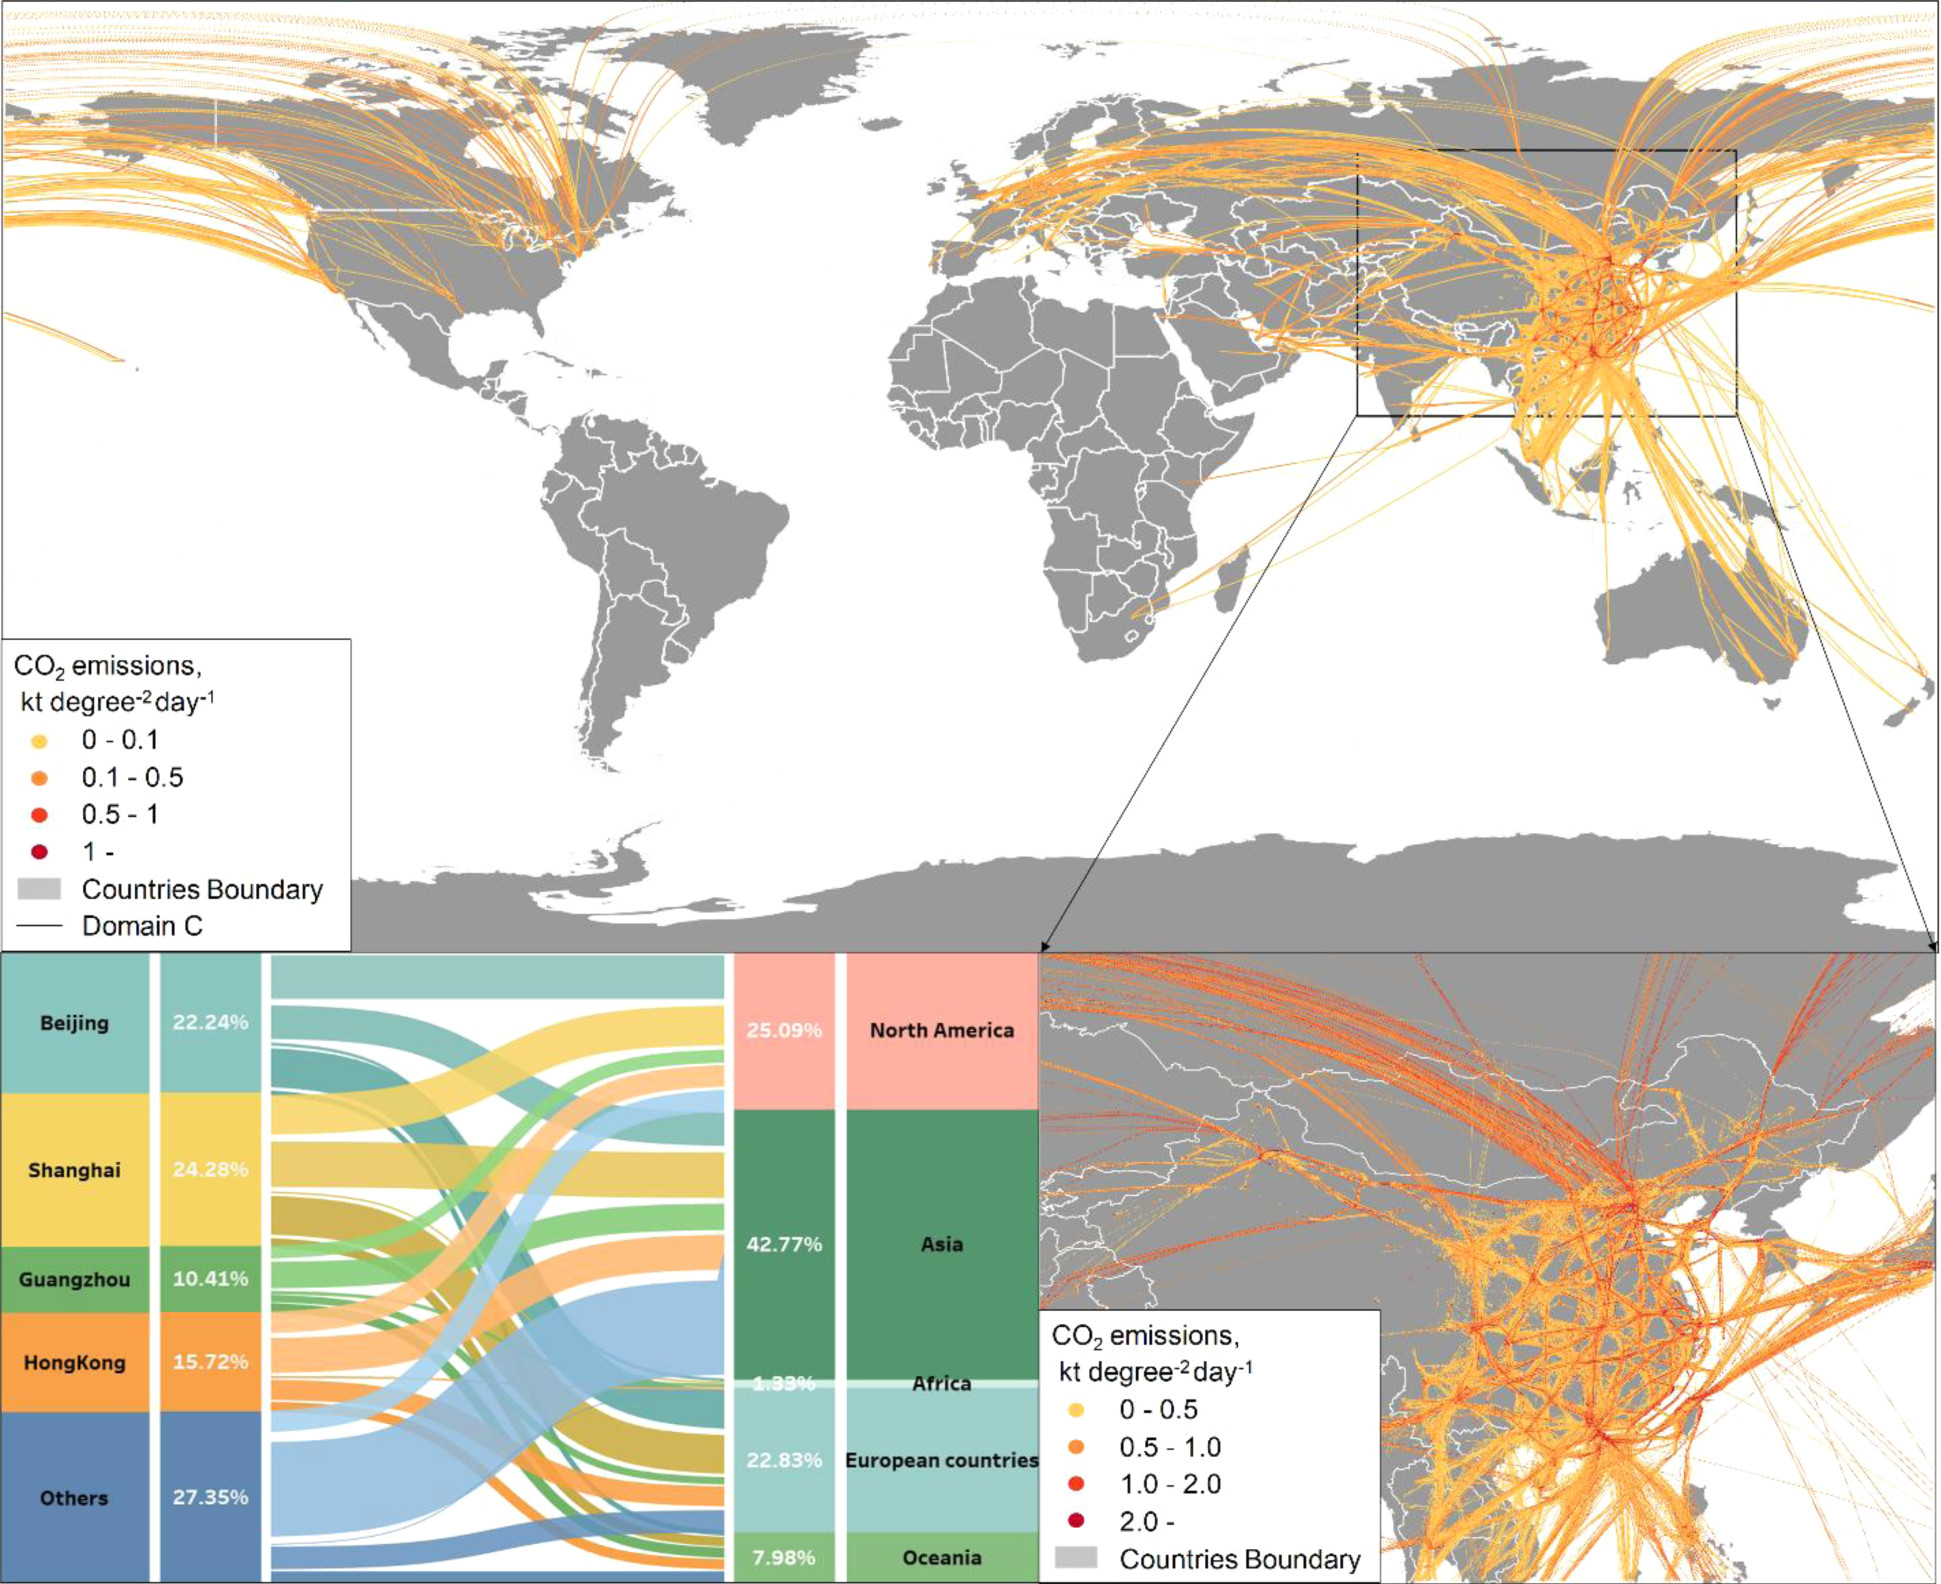
The research showed that the passenger aviation sector in China was estimated to be responsible for 37.2 million tons of fuel consumption and 117 million tons of CO2 (see Figure 2). In terms of pollutants, NOx emissions are 753.7 kilotons, hydrocarbon (HC) emissions 19 kilotons, and micro particulate matter (PM) emissions 2.4 kilotons. The top five domestic routes in terms of CO2 emissions were Beijing-Guangzhou, Beijing-Shanghai, Beijing-Shenzhen, Beijing- Chengdu and Shanghai-Shenzhen, contributing to total CO2 emission of 2.2-3.1 kilotons per day. For aviation CO2 emissions from international flights, Asian flights accounted for the largest proportion, reaching 43% (of which Japan accounted for 7.9%, Thailand 7.8%, and South Korea 4.2%), followed by North America (25%) and Europe (23%).

Figure 2 Spatial distribution of CO2 emissions from China's aviation industry and the relationship between origin and destination (O-D) of international routes
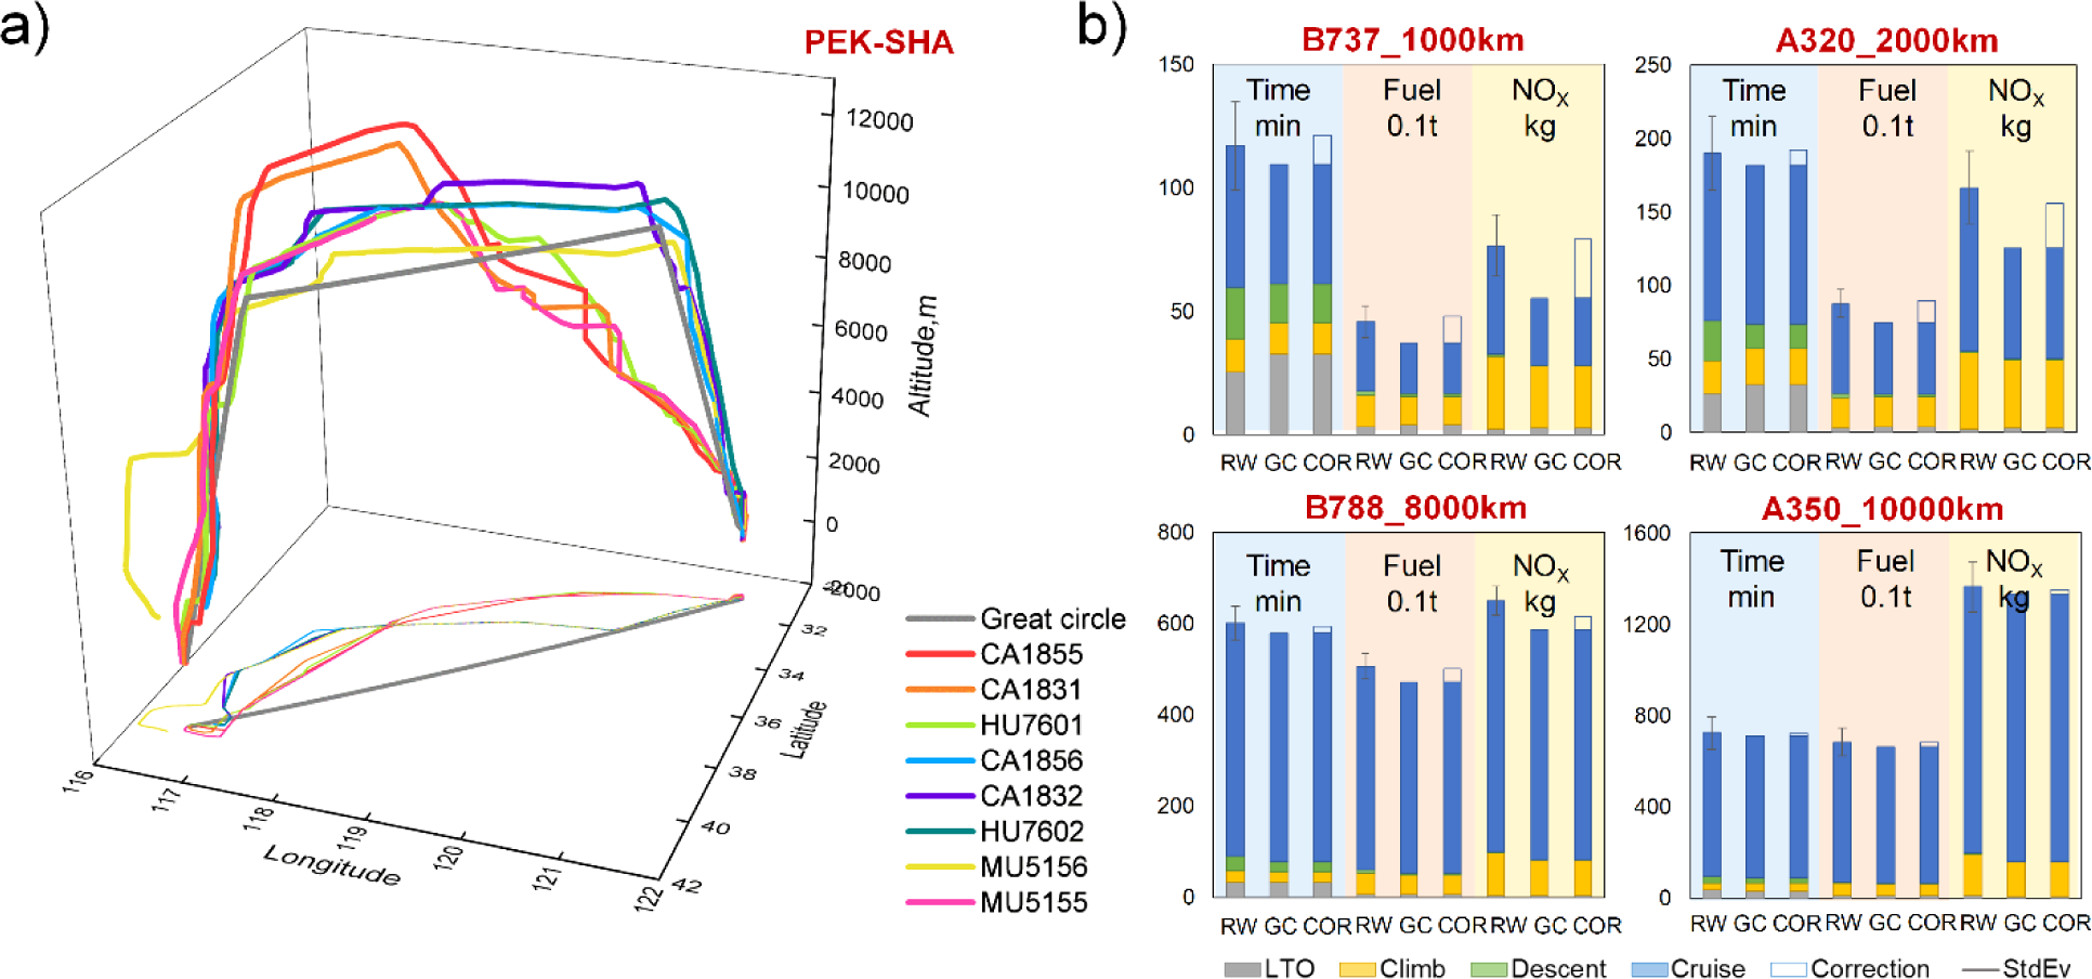
This study compares the developed model based on real-world flight trajectory (ADS-B approach, this study) with the conventional great-circle-based trajectory model (GCAP approach) (see Figure 3). The simulation results of short-distance flights indicated that the GCAP model significantly underestimated fuel consumption and NOx emission by 15% -19% and 25%-28% respectively. The leading contributor to the difference was from the cruising phase. For the cruising phase, the GCAP approach underestimated fuel consumption by 20%-28% and NOx emission by 32%-39%. It is found that the difference mainly lies in aircraft performance and the actual ADS-B trajectory cruise altitude was usually 10 to 15% lower than the theoretical cruise altitude suggested by the GCAP approach, resulting in a lower cruise speed and thus a longer duration. The higher cruise altitude suggested by the GCAP approach led to a lower fuel consumption (15%), which further decreased the NOx emission factor (16%). In addition, ADS-B approach can capture the true attitude of stepped descent, and the emission spatial distribution of ADS-B approach is significantly different from that of GCAP approach. This study further adjusted the cruise speed and cruise altitude from the default GCAP results to those based on actual trajectory profiles. As a result, the gaps between the two methods in fuel consumption and NOx emissions was substantially narrowed to within 6%. The remaining discrepancies would be primarily attributed to associated corrections of actual flight information (e.g., meteorological conditions) and discrepancies of other subphases (e.g., gradual descent), and it would still be challenging for the GCAP approach to reflect these complex issues for the time being.

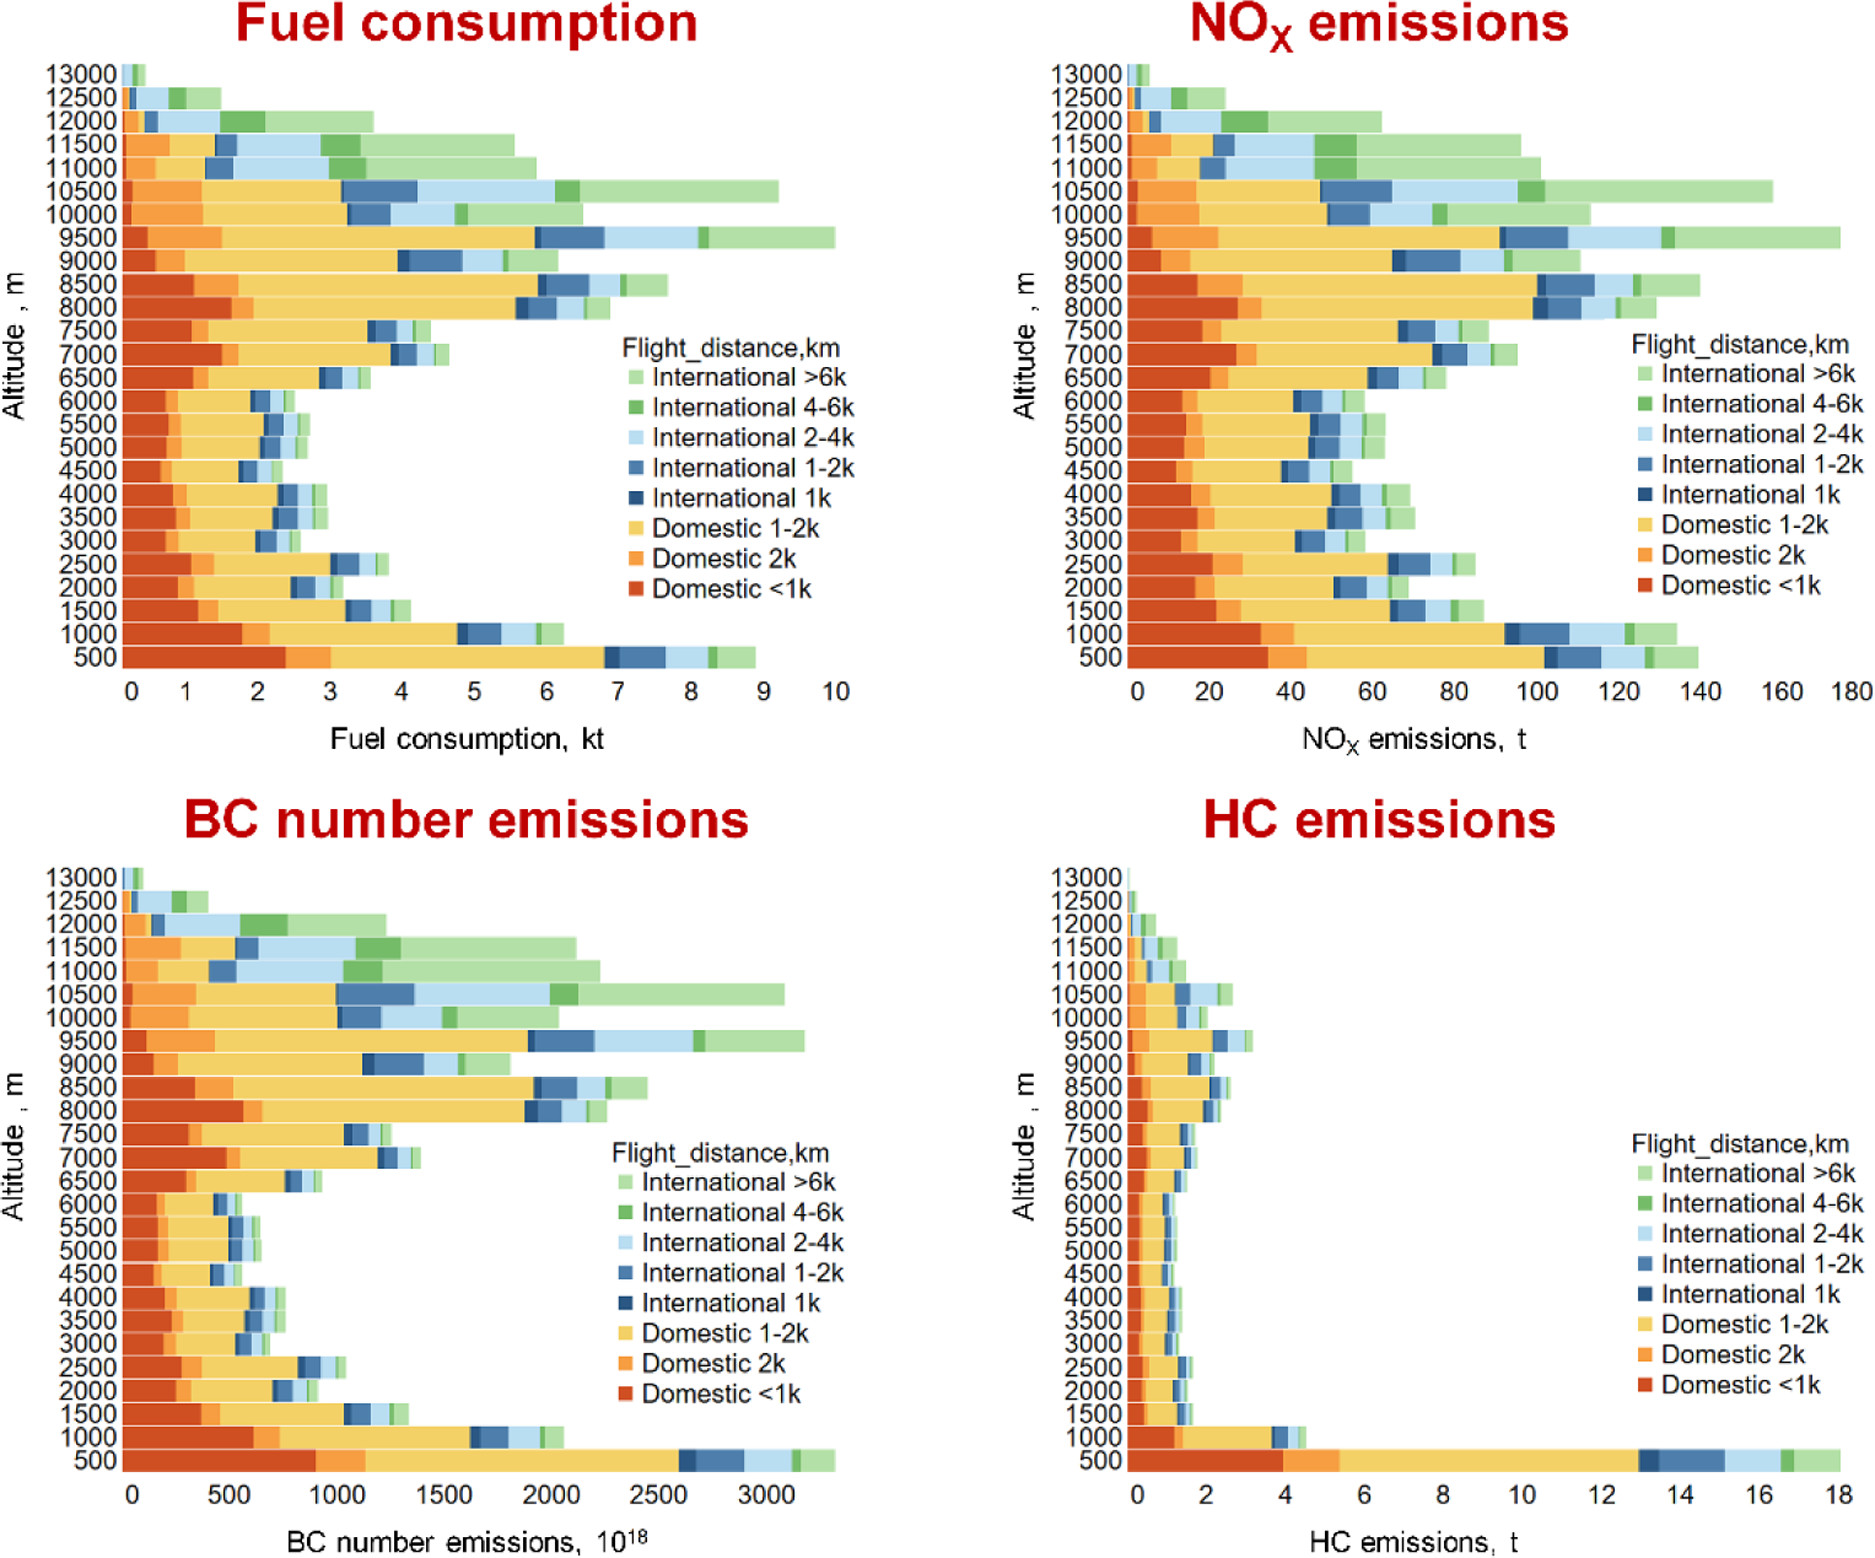
The results indicated that fuel consumption and CO2 emissions showed two peaks in altitude distribution: below 1,000 m and between 8,000m and 12,000m (see Figure 4). For cruise-phase emissions, the values for domestic flights were concentrated at 8,000m to 10,000m, while those for international flights were predominantly at 10,000m to 12,000m. The distribution of pollutants is affected by the formation mechanism. For example, the distribution of NOx was similar to that of CO2 because NOX production is dominated by thermal reactions, while the proportion of HC at the low-altitude stages was significantly higher than that of CO2 due to the incomplete combustion under low-load conditions. The fuel consumption of domestic flights accounted for 12-15% in the LTO phase (<914m) and 56%-59% in the cruise phase. Since the duration of LTO from ADS-B data was longer than the standard one, the proportion of the LTO phase was higher than that in previous studies (5-10%).

Figure 4 Vertical distribution of fuel consumption and pollutant emission of aviation in China
At present, the calculation method of civil aviation emissions during LTO phase mentioned in the China’s Technical Guidance to Prepare a Non-Road Mobile Source Emissions Inventory (hereinafter referred to as the Technical Guidance) is based on the number of landing and take-off cycles without considering aircraft types and operation time. This study found out that the emission of a single LTO cycle varies considerably in different airports, up to 2-4 times, which is mainly attributed to the composition of the aircraft fleet. Therefore, the simple index in the Technical Guide cannot fully reflect the characteristics of specific airports. Taking Beijing Capital International Airport (PEK) as an example, as PEK offers a large number of international and domestic flights, its wide-body aircraft account for a relatively high proportion. Therefore, the NOx emission of a single LTO cycle there is about twice the average value recommended in the Technical Guidance. Direct adoption of the recommended value will cause a large degree of underestimation.
The study, entitled "Developing a High-Resolution Emission Inventory of China's Aviation Sector Using Real-World Flight Trajectory Data", was officially published in Environmental Science & Technology on May 3, 2022, and was selected as one of the supplementary cover articles in this issue.
The first author of the paper is Zhang Jingran, a PhD student at the School of Environment, Tsinghua University. The corresponding author of the paper is Zhang Shaojun, Associate Professor at the School of Environment, Tsinghua University. Professor Wuye and Academician Hao Jiming of the School of Environment and Professor Wang Jing and Dr. Zhang Xiaole of ETH Zurich provided great assistance in the results and discussion section. The research was supported by China's National Key R&D Program and other programs.
The Supporting information is available free of charge at:
https://pubs.acs.org/doi/10.1021/acs.est.1c08741


